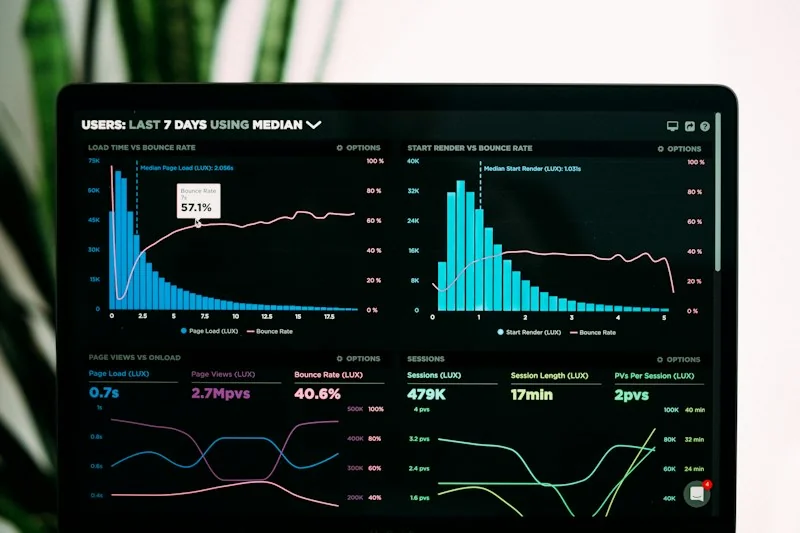
Executive dashboards transform management: you stop wondering what happened in the past and start anticipating what is coming next.
The Difference Between Reacting Late and Leading the Market
Imagine driving a car where the speedometer and fuel gauge only updated once a month. It would be impossible to avoid accidents or running out of fuel on the highway. Yet that is precisely how many business owners manage their companies: waiting for month-end accounting reports to find out which SKUs lost money or which branch missed targets.
In dynamic, competitive markets, executive reaction speed is your ultimate competitive edge.
The 4 Vital Indicators You Need on Your Mobile Screen:
1. Net Profit Margin per Branch in Real Time
Not just gross revenue, but actual net cash generated after factoring in exact cost of goods sold and daily operational overhead.
2. Top Stockout Risk SKU Ranking
A visual alert highlighting the 5 high-demand items that will run out in the next 48 hours unless a purchase order is issued today.
3. Overdue Accounts Receivable and Projected Cash Flow
Expected cash inflows this week weighed against payroll and supplier obligations, eliminating surprise liquidity shortages.
4. Commercial Team Performance and Quota Tracking
Daily tracking of sales target achievement broken down by executive, territory, or commercial channel (in-store, wholesale, e-commerce).
Fewer Endless Meetings, More Decisive Execution
When operational data is unified into clean, visual dashboards, executive meetings stop being debates over 'whose spreadsheet numbers are right' and become strategic sessions focused on revenue growth.
Is your enterprise facing this challenge today?
Connect directly with our engineering team on WhatsApp to evaluate the technical solution for your business.